
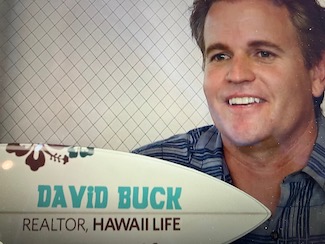
I can't believe it's been 10 years since I did my 1st episode on HGTV. We're back in the same office space here in Kahala where we filmed that episode and I thought it would be fun to take a step back and see what's changed over the past 10 years.

Kahala Office
In addition to my hair color and my aloha shirts fading (yes, I do own the same aloha shirts), I thought it would be cool to revisit some of the neighborhoods in East Honolulu and see how the prices have appreciated over the past 10 years. So, sit back and enjoy. We're going to revisit the areas we shot ini that episode and bear with me. I'm not going to have all the cool production crew around me and microphones. But, I think it will be fun to see what's happened in our marketplace over the past 10 years.
Kalani Iki
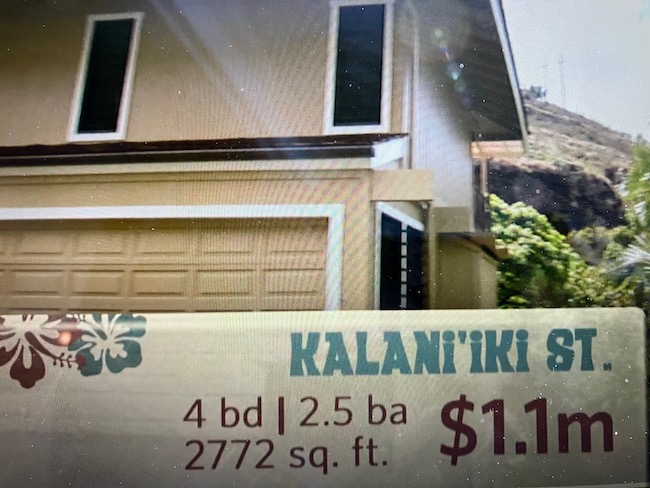
Here we are at the entrance to Kalani Iki Valley and the home we saw back then was a 4 bedroom, 2.5 bath listed at $1.1 million. It was over 2,700 square feet under roof. Today, there's a few listings on the market that range from $1,275,000 for only a 2 bedroom, 2 bath. That one is only 1,464 square feet. There's also another one that 3 bedrooms, 2.5 baths at 1,678 square feet and that's listed for $1,499,000. So, prices have definitely gone up since 2013.
There are now 2 sales in the last 6 months and those traded in the $1.3 to $1.4 range. So, at 2,700 square feet what we were looking at back then aa an asking price of $1.1, if I had to guesstimate something like that today would be $1.5 most likely. The maintenance fees have also gone up. That was a concern in the episode. They were $900 back then and they're well north of $1,000 now. However, some of that money has gotten reinvested over the past year or two. They've redone the swimming pool area and the tennis court. So, Kalani Iki is still a trophy area, a great location close to town. That's a wrap on Kalani Iki and it's been wild what's been happening over the past 10 years.
Gateway Peninsula
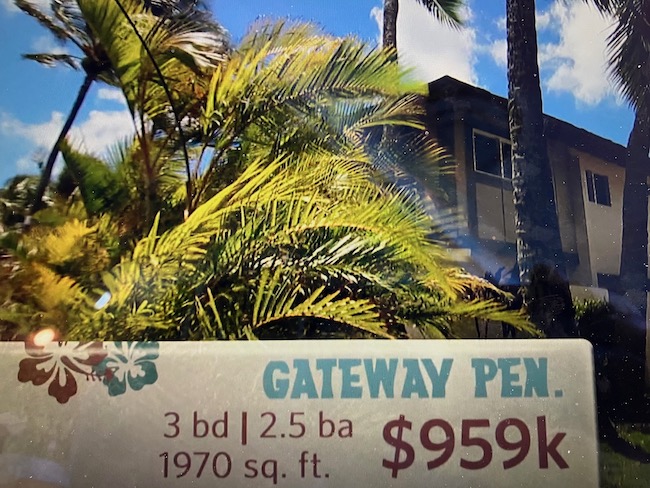
Here we are at Gateway Peninsula directly behind me and we've got Duck Island directly over my shoulder, hence the ducks you hear on the background. Back in 2013, the unit we were looking at was going for $959,000. They are all pretty much 3 bedrooms, 2.5 baths. That one was completely done and remodeled. Right now, today, there is one in escrow for $1,250,000 at Gateway Peninsula and the last 2 sales that took place were $1,255,000 and $1,370,000.
Prices have shot up at Gateway Peninsula over the past 10 years and you've got great company with the ducks around here. It's a beautiful day in Hawaii Kai and that's what's happening in Gateway Peninsula over the course of the last 10 years. Mahalo.
Aina Haina
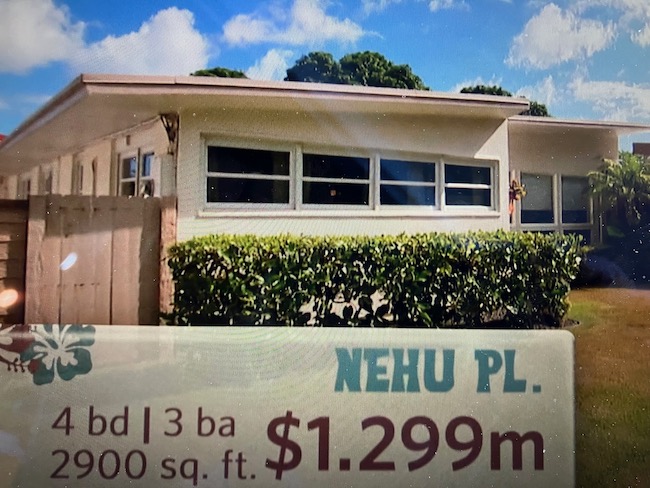
Here we are in Aina Haina and the home that we shot in 2013 is directly behind me, but this will give you a good perspective of the valley because what we looked at was in the flats. It's a vast valley with over 1,000 homes. The one we saw 10 years ago was a 4 bedroom, 2 baths and it was listed for $1,299,000. Current inventory right now in Aina Haina is going between $1,098,000 to $1,499,000. But, they're much smaller lots on the sides of the valley more like 7,500 square feet vs. a quarter acre down in the valley like the one we saw.
A home traded in the last 6 months (very similar to the one we saw) that went for $2.1 million. So, that's a big bump up in price. There's also one right down the way here that's newer construction a similar size that's in escrow for $3.5 million. So, Aina Haina is seeing a lot of appreciation over the past 10 years and that's a wrap.
Summary
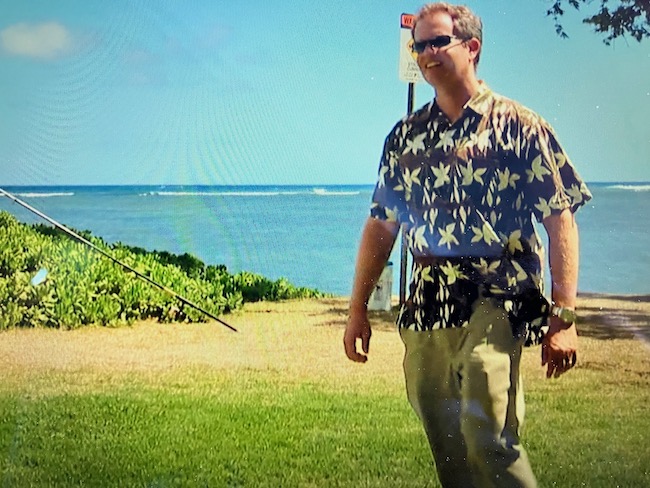
We're back at Kawakui Beach Park, which is where Keoni and Eliza made their decision on the house. We're not going to get in that right now. To see their decision, you're going to have to watch the episode. To just recap what's happened in the last 10 years, in Kalani Iki you saw a house back then going for $1.1 million. Something similar today would arguably be worth $1.5 million or more. The maintenance fees have gone up. Gateway Peninsula was at $959,000 back then and arguably something like that would be around $1.3 million today. Last, but not least, Aina Haina, right across the way here was just under $1.3 million. A home of that stature today would be definitely well into the $2 million range. So, if I were to say which one appreciated most, for sure Aina Haina. On a percentage basis, Aina Haina might be that frontrunner as well.
Who knows what the next 10 years will hold?
If you're trying to figure out what's happening here on Oahu or want to get in on this market, every market is different, so feel free to reach out and I'd be glad to help you. Mahalo.


